Using scripted diagrams
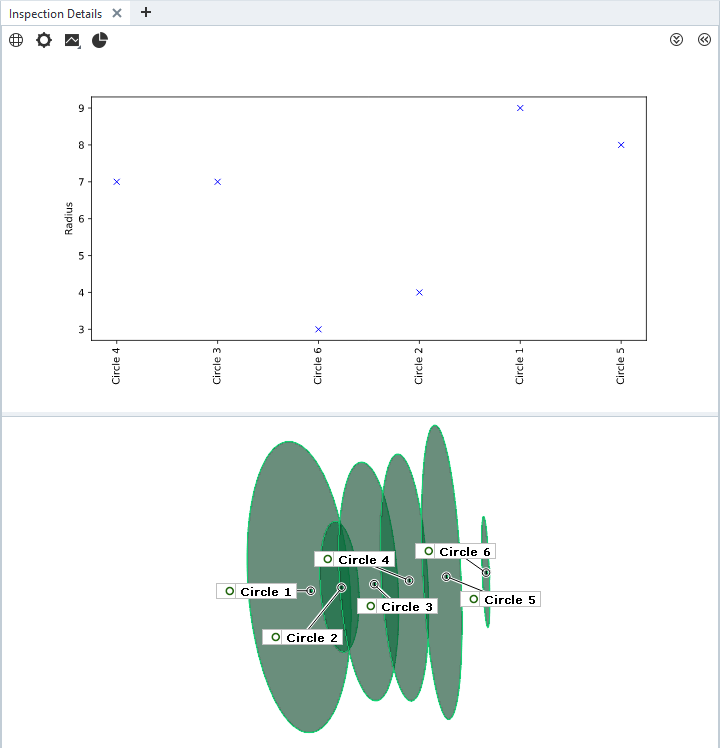
Abstract: Scripted diagrams allow visualization of any kind of data available within ZEISS INSPECT in any diagram style provided by Python packages like Matplotlib or user-defined code. Scripted diagrams are a complement to the ZEISS INSPECT built-in diagrams. They receive data from specific scripted elements and provide an SVG (Scalable Vector Graphics) image which is displayed on the tab Inspection Details in the 3D view. Scripted diagrams have been introduced in ZEISS INSPECT 2025.
Note
Scripted diagrams are updated automatically if any contributing scripted element changes.
Note
You can use multiple scripted diagrams at the same time, which will be stacked vertically in the Inspection Details tab.
Prerequisites
The concept of scripted diagrams builds upon scripted elements and services. Tokens on scripted elements are used to convey data to the diagram service.
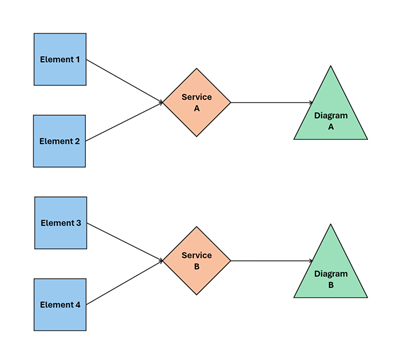
Each diagram service combines data from one or more scripted elements to create a single scripted diagram.
Usage
1. Create or modify scripted elements to contribute data to a scripted diagram
Any kind of scripted element can provide data to a scripted diagram.
In the scripted element’s calculation() function, apply context.data[] as in this example:
context.data[stage] = {
    "ude_diagram_custom": 1, # mandatory, fixed
    "ude_diagram_type": "SVGDiagram", # mandatory, fixed
    "ude_diagram_service" : "gom.api.diagram.radius_plot", # <service_endpoint>.<service_function_name>
    # add any number/type of parameters for use in a diagram
    # prefix must be ude_diagram_
    "ude_diagram_radius": params['radius']
}
The dictionary elements
"ude_diagram_custom"and"ude_diagram_type"are currently fixed. Additional diagram types might be added later."ude_diagram_service"maps the scripted element to a diagram service, which is defined in the App’smetainfo.jsonfile.Any number and type of parameters to be passed to the diagram service can be added. The prefix
ude_diagram_is mandatory.
2. Define the diagram service in metainfo.json
3. Create the diagram service function
Important
The service script name must be the same as defined in
metainfo.jsonThe service function name must be the same as set in the scripted elements’
"ude_diagram_service"parameter.
Diagram service function description
The scripted diagram’s service function implementation must adhere to the following interface description:
- <function name>(view, element_data): str
Create an SVG diagram based on scripted elements’ context data
- Parameters:
view (dict) –
ZEISS INSPECT ‘Inspection Details’ canvas properties
’width’: (int) Canvas width in pixels
’height’: (int) Canvas height in pixels
’dpi’: (float) Canvas resolution in dpi
’font’: (int) Default font size in pt
element_data (list[dict1, dict2, …, dictN]) –
List of dictionaries containing scripted element references and context data
’element’: (object) Element reference
’data’: (dict) Context data of the scripted element
’type’: (str) Element type (always ‘SVGDiagram’)
- Returns:
SVG diagram
- Return type:
str
Template
The following script serves as a minimum template for a scripted diagram service:
import gom
from gom import apifunction
import gom.api.extensions.diagrams.matplotlib_tools as mpltools

@apifunction
def diagram_service_template(view, element_data)->str:
    gom.log.info('Diagram Service Template')
    gom.log.info(f'{view=}, {element_data=}')

    # Prepare plotting
    mpltools.setup_plot(plt, view)

    for e in element_data:
        # Read element reference
        element = e['element']

        # Read scripted element's context data
        data = e['data']

        # Create your diagram
        # Example:
        plt.plot ([element.name], [data['ude_diagram_radius']], 'bx')

    return mpltools.create_svg(plt, view)

gom.run_api()
To export the diagram as SVG file (e.g. for debugging):
# Set path for debugging
#SVG_PATH = None
SVG_PATH = 'C:/temp/ScriptedDiagram.svg'

@apifunction
def diagram_service_template(view, element_data)->str:
    # ...

    svg = mpltools.create_svg(plt, view)

    if SVG_PATH:
        with open(SVG_PATH, "w") as f:
            f.write(svg)

    return svg

gom.run_api()
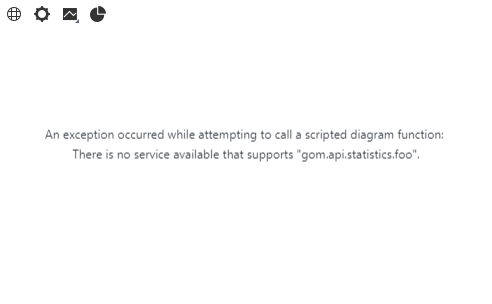
Error handling
Errors in a scripted diagram service function are reported into the service’s log, see Using services.
Errors related to the connection between scripted elements and a diagram service are shown in the Inspection Details tab instead of an actual diagram: